The Mighty Loop
Automating repetitive tasks with Stata’s foreach loop function
Table of Contents
What is foreach for?
In Stata you often need to do the same repetitive and boring tasks over and over. For example, you might have two groups where you want to make a histogram and run a t-test for 10 different variables. You could easily achieve this by copy pasting:
sysuse auto, clear

histogram price, by(foreign)
ttest price, by(foreign)

histogram mpg, by(foreign)
ttest mpg, by(foreign)
...
This is a perfectly fine way of writing your code. It is easy to read and understand and the risk of errors is minimal. However, it can be quite time-consuming to copy-paste endless lines of the same code, especially if you also want to export histograms, store the results, etc. If you have this kind of scenario, then allow me to introduce your new best friend/function: foreach
foreach is Stata’s command for running a loop. A loop or looping is programming lingo for running the same section of code several times. The syntax looks like this:
foreach x in varlist {
  Run some code
}
foreach repeats the code between { and } for each element within the varlist (hence the name). varlist contains the list of variables that the code should be repeated for. varlist can both be strings, numbers, variables names, or macros (though the syntax is slightly different for macros). Every time the code is run, x is changed to new value in varlist. In other words, you can use x in your loop as a placeholder for all the variables you want to repeat your code for.
Don’t worry, if it seems a bit abstract. It is a lot easier to understand when working with examples.
Example: Simple loop through list of variables
This foreach loop runs through all variables and makes a histogram and t-test for each variable.
sysuse auto, clear
foreach var in price mpg rep78 headroom trunk weight length turn displacement gear_ratio {
  display "`var'"
  histogram `var', by(foreign)
  graph export histogram_`var'.png, replace
  ttest `var', by(foreign)
}
Now histograms and t-tests are repeated for all variables in the varlist (price mpg headroom etc), by referring to the var. Writing this loop was way faster than copying the same lines of code for all variables. And if we decide to change the layout of the histogram or add more code, we only have to change the code within the loop instead of changing 200 lines of copy/paste. Smart.
Note, that display actually isn’t necessary for this loop to run. I just prefer to start loops with the display command, so Stata tells me which variable it is currently processing. This is helpful if (when!) you need debug some unforeseen error in your loop.
Example: Export results from tables
While the example above is pretty neat, it would be nice if the p-values from the t-test were stored somewhere, so we don’t have to manually copy-paste from Stata’s output into our paper/table/whatever. This can be achieved by running the same loop as above but exporting results to a txt file:
sysuse auto, clear
file close _all
file open textfile using "results.txt", write replace
file write textfile "Var name" _col(20) "p-value" _n
foreach var in price mpg rep78 headroom trunk weight length turn displacement gear_ratio {
  display _n "`var'"
  ttest `var', by(foreign)
  local pval = `r(p)'
  file write textfile "`var'" _col(20)  "`pval'" _n
}
file close _all
Here we simply write the p-values, that Stata automatically stores after a t-test as r(p), to a textfile. We use _col() and _n() to format the textfile by adding spaces and new lines, respectively. The resulting txt file should look like this: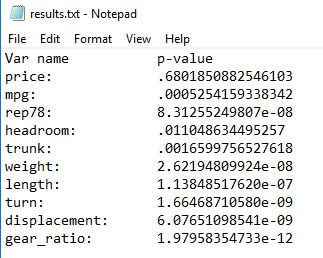
Typically, you don’t want more than three digits on your p-values. To achieve this, you need to round the p-value and format it as a text string:
local pval = string(round(`r(p)', 0.001), "%4.3f")
Also, by convention p-values should be given without a leading zero. We can use subinstr (“substitute in string”) to remove the first zero from the string:
local pval = subinstr(string(round(`r(p)', 0.001), "%4.3f"), "0", "", 1)
Now you would of course never (!!!) make a table with p-values without also adding the estimates and confidence intervals. Luckily, Stata usually stores all the important results in p(whatevername). You can find out what Stata has stored -and under which names- by typing return list after you’ve run a command. Use the example above to add CI95%, N, and whatever results you need. Note, that sometimes results are stored in matrices, which are considerably more hairy to deal with.
More examples?
I’ll add more examples on how to use foreach as I come across them. Get in touch, if you have suggestions.